

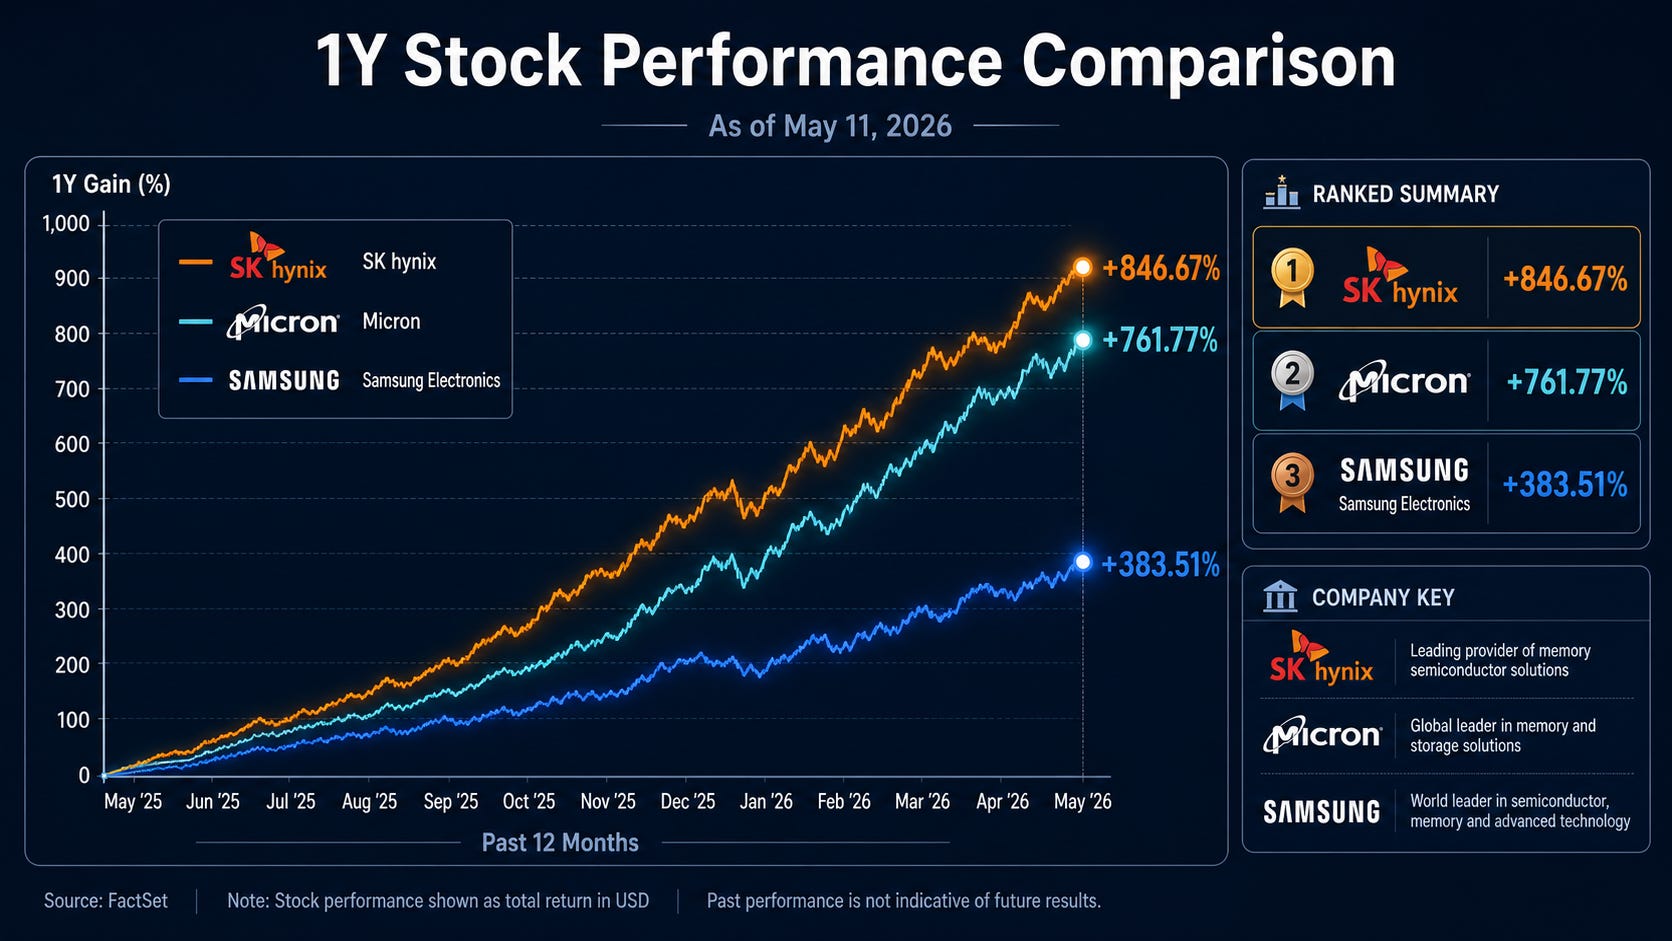
SK hynix posted 72% operating margin in a single quarter. Micron is locking in 3-to-5-year supply agreements. Samsung had a quarter where conventional DRAM profitability exceeded HBM.
Memory stocks have gone on a tear. And the market’s question is simple. Can this rally continue.
Most analysis looks at total HBM demand. Demand goes up, stocks go up. Demand slows, stocks pull back.
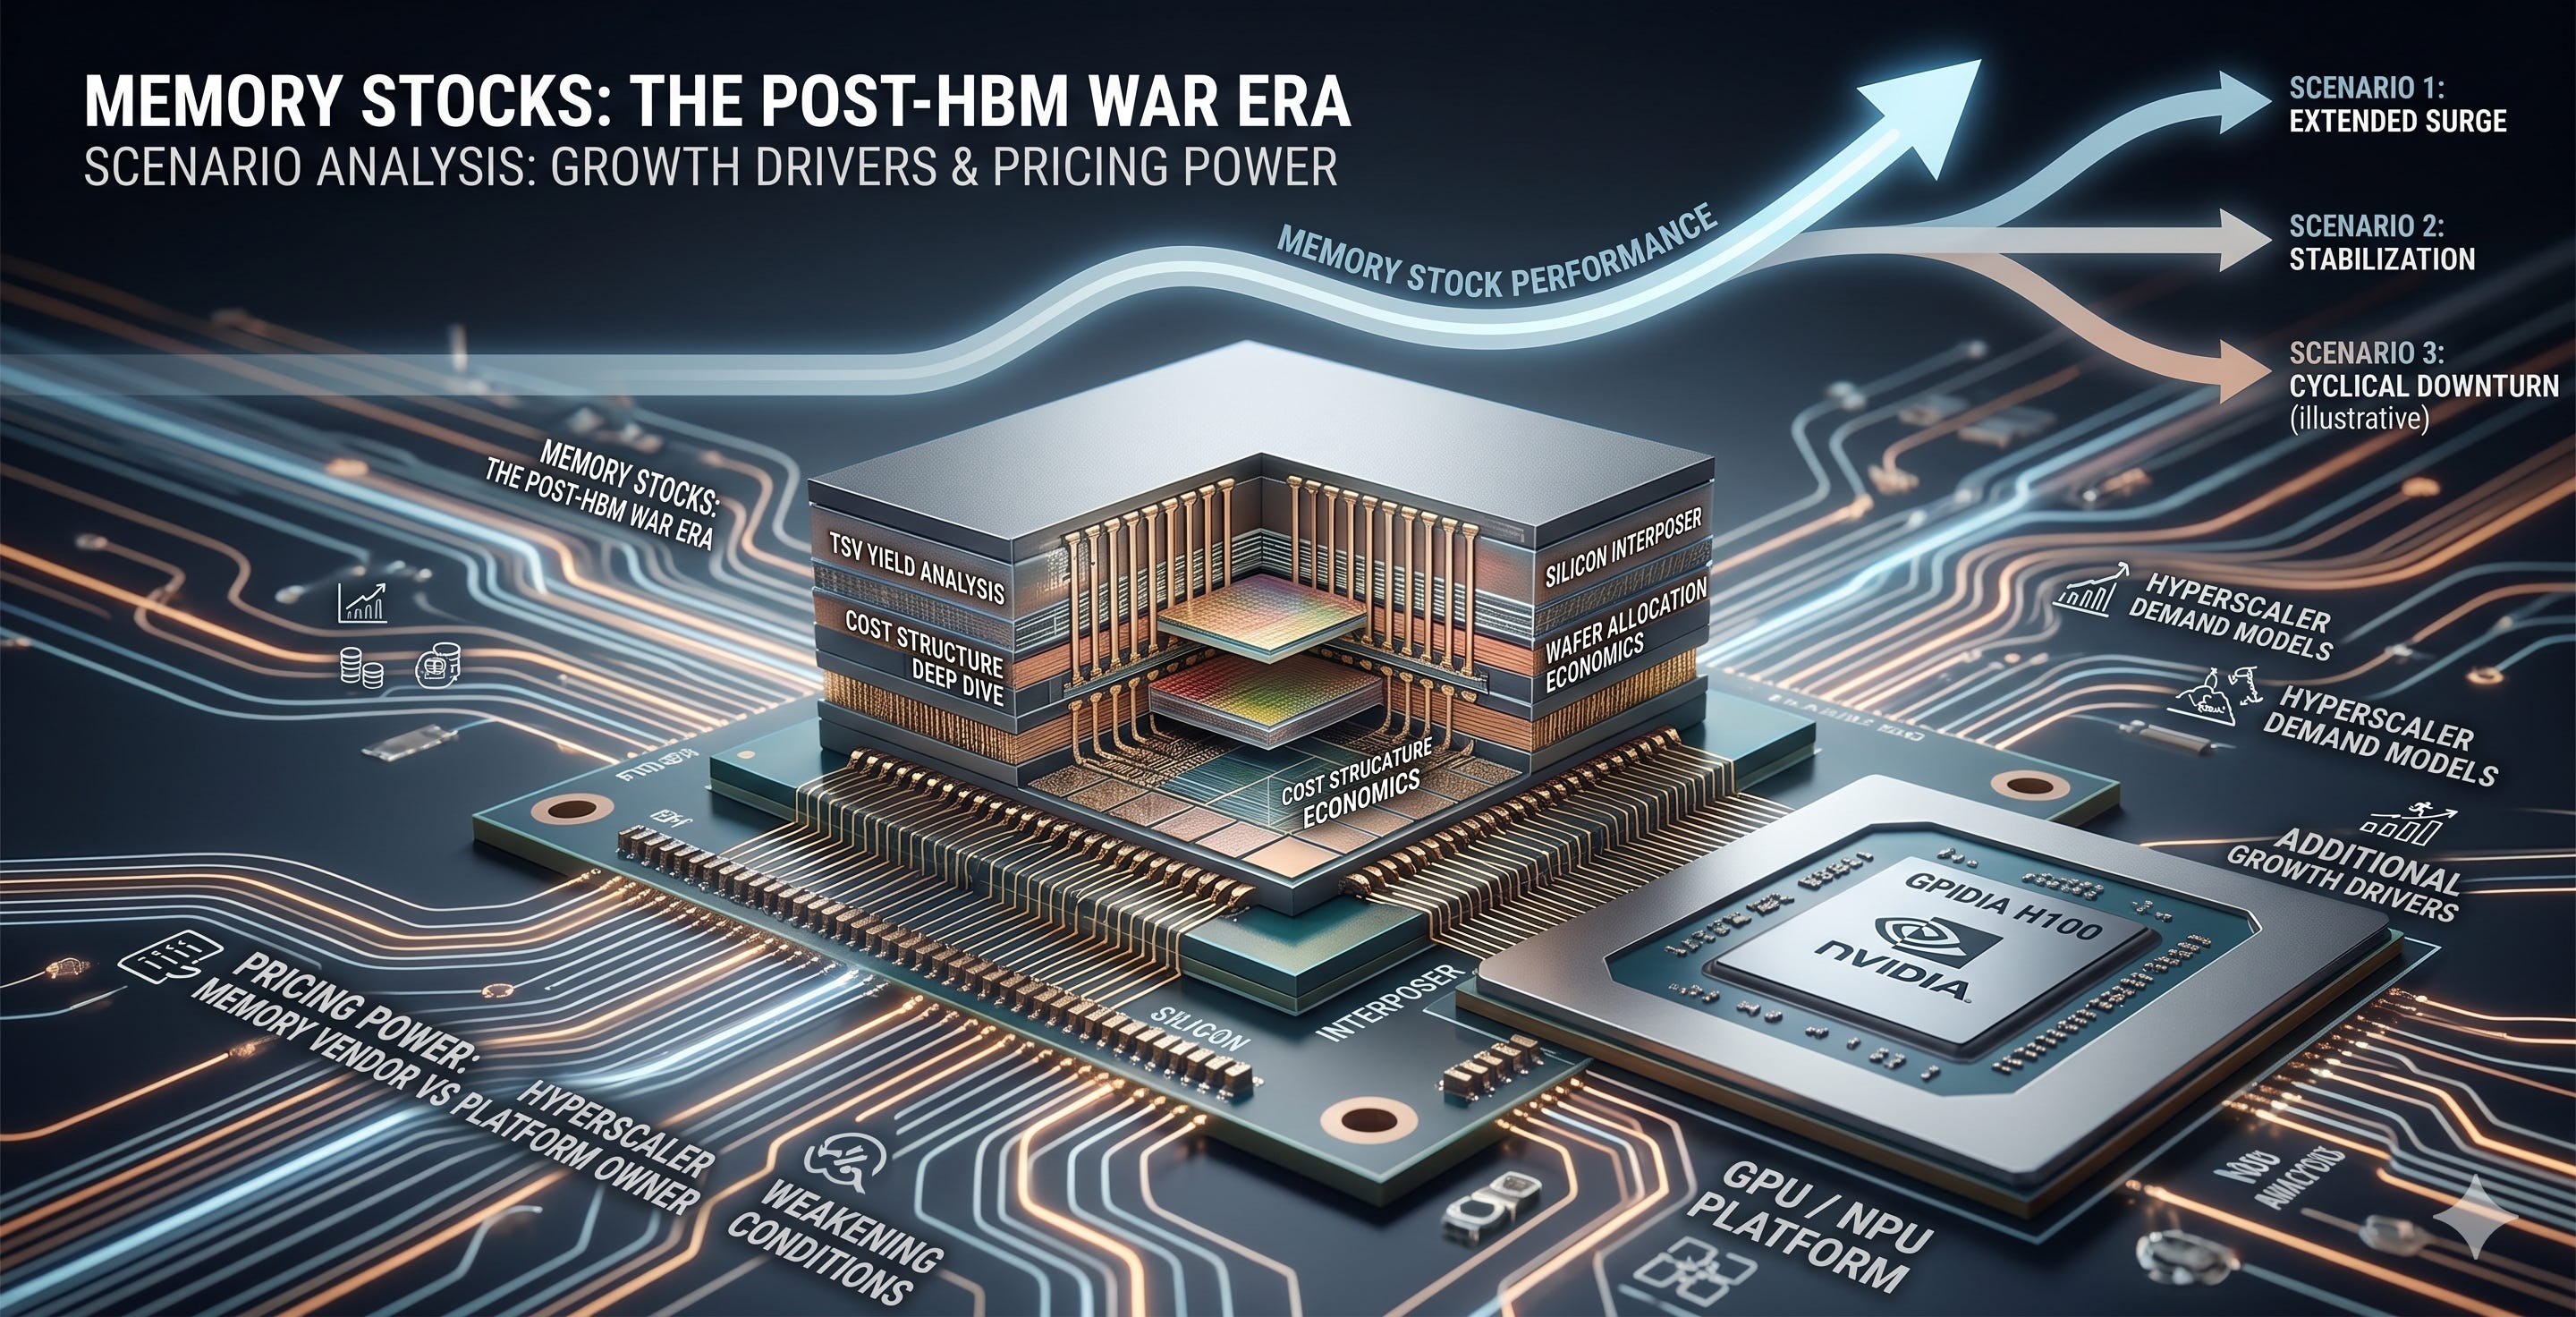
This article looks somewhere else. Not total HBM demand, but where HBM pricing power holds and where it starts to crack. What determines the next round of memory stock performance is not how much HBM gets sold, but at what price.
The approach is to deep dive into HBM’s cost structure and wafer allocation economics, then analyze the strategies of both memory vendors and platform owners (NVIDIA and hyperscalers) through the lens of pricing power. From there, map the additional drivers that could sustain the memory stock rally and the conditions under which those drivers weaken, organized by time horizon.
This article is not investment advice and does not recommend buying or selling any specific stock. All investment decisions and their consequences are the responsibility of the individual investor.
HBM Is Not Coming Off the Throne
HBM is still in shortage. And that shortage is unlikely to ease anytime soon.
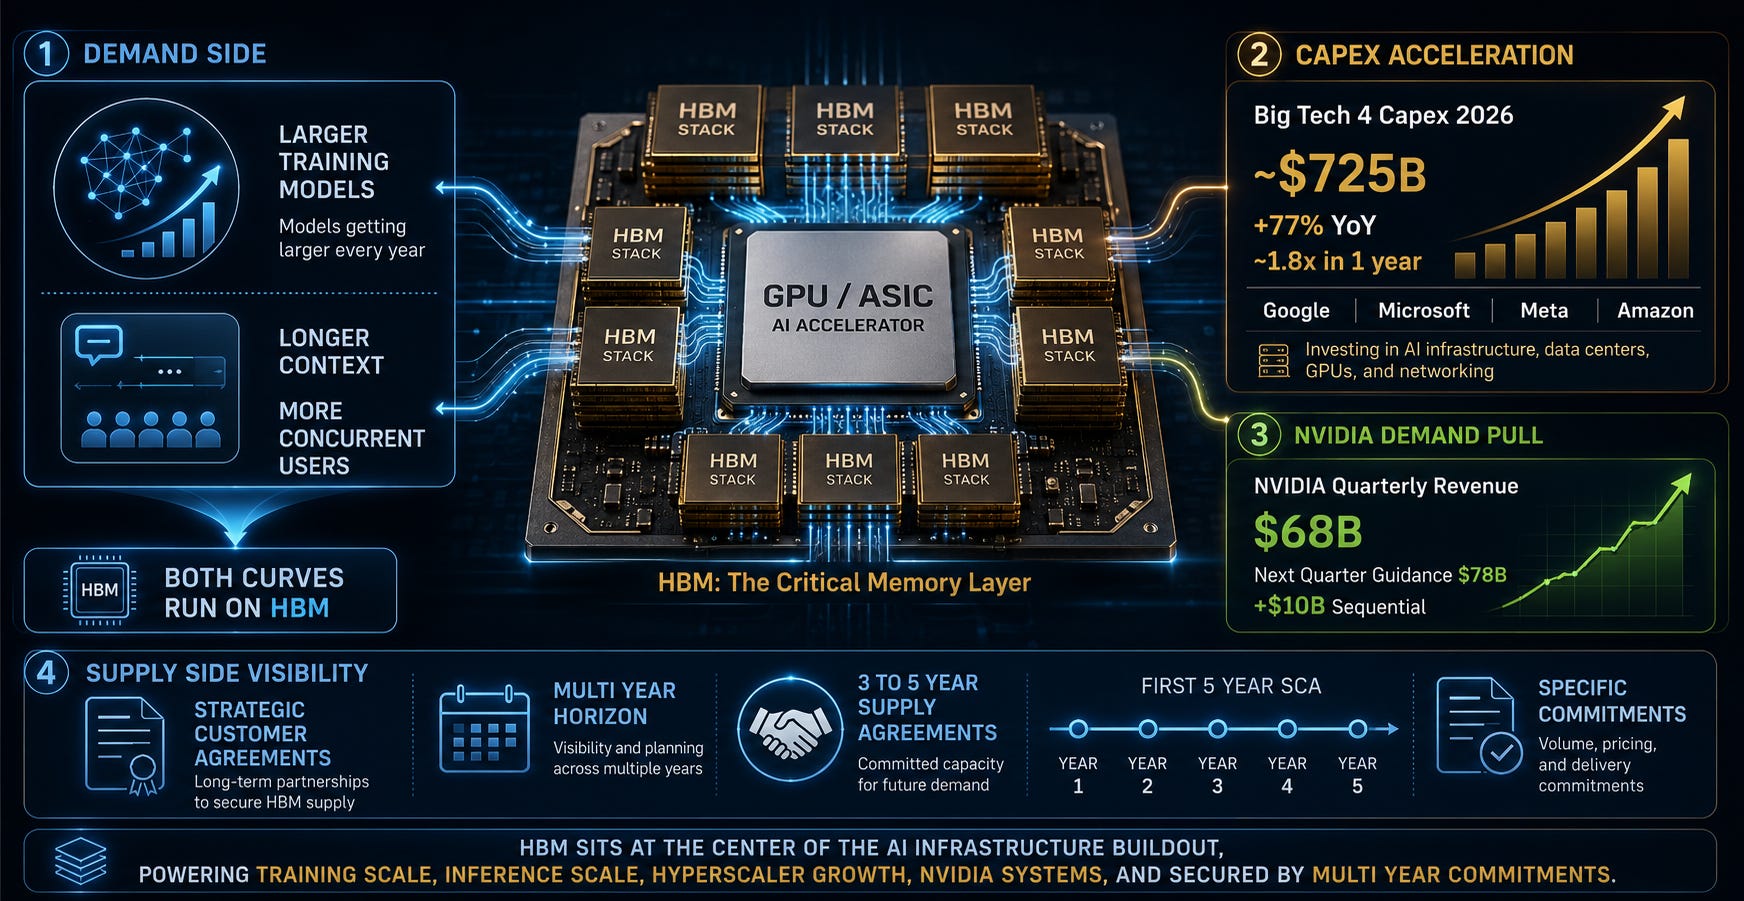
Most of the expensive training GPUs and high-end inference ASICs powering the AI era depend deeply on HBM-class memory. Training models get larger every year, and inference services are starting to handle longer contexts and more concurrent users. Both curves run on top of HBM.
The numbers are visible. Combined 2026 capex for the Big Tech 4 (Google, Microsoft, Meta, Amazon) is projected at roughly $725B, up approximately 77% year over year, nearly 1.8x in a single year. Capex is capital expenditure: spending on building data centers, buying GPUs, and laying out networks.
A large share of this goes to AI infrastructure, and on top of that, NVIDIA posted roughly $68B in quarterly revenue while guiding roughly $78B for the following quarter. That is about $10B of incremental growth in a single quarter. Running this system requires HBM.
The supply side tells the same story.
Micron disclosed on its March 2026 earnings call that it has strategic customer agreements and specific commitments across a multi-year horizon, and has entered its first 5-year SCA (Strategic Capacity Agreement). Separate multi-year supply agreements spanning 3 to 5 years with certain customers fall in the same context.
Understanding why the 3-to-5-year figure matters requires knowing how memory semiconductors have historically traded. DRAM has always been a market where prices shift every quarter.
A chip priced at $10 this quarter might be $7 next quarter, or $14. Prices moved on a near-spot basis, quarter by quarter, driven by supply and demand. HBM has moved to a different game: lock in 3-to-5-year contracts first, then secure volume. The fundamental transaction structure of the DRAM market has changed.
So the starting point is this. HBM has not weakened. If anything, it has gotten too strong.
Everyone knows the memory stock rally comes from here. The question is what happens next.
As the Throne Grows, So Does the Cost Problem
As HBM has gotten stronger, it has also become too expensive a component inside a single GPU.
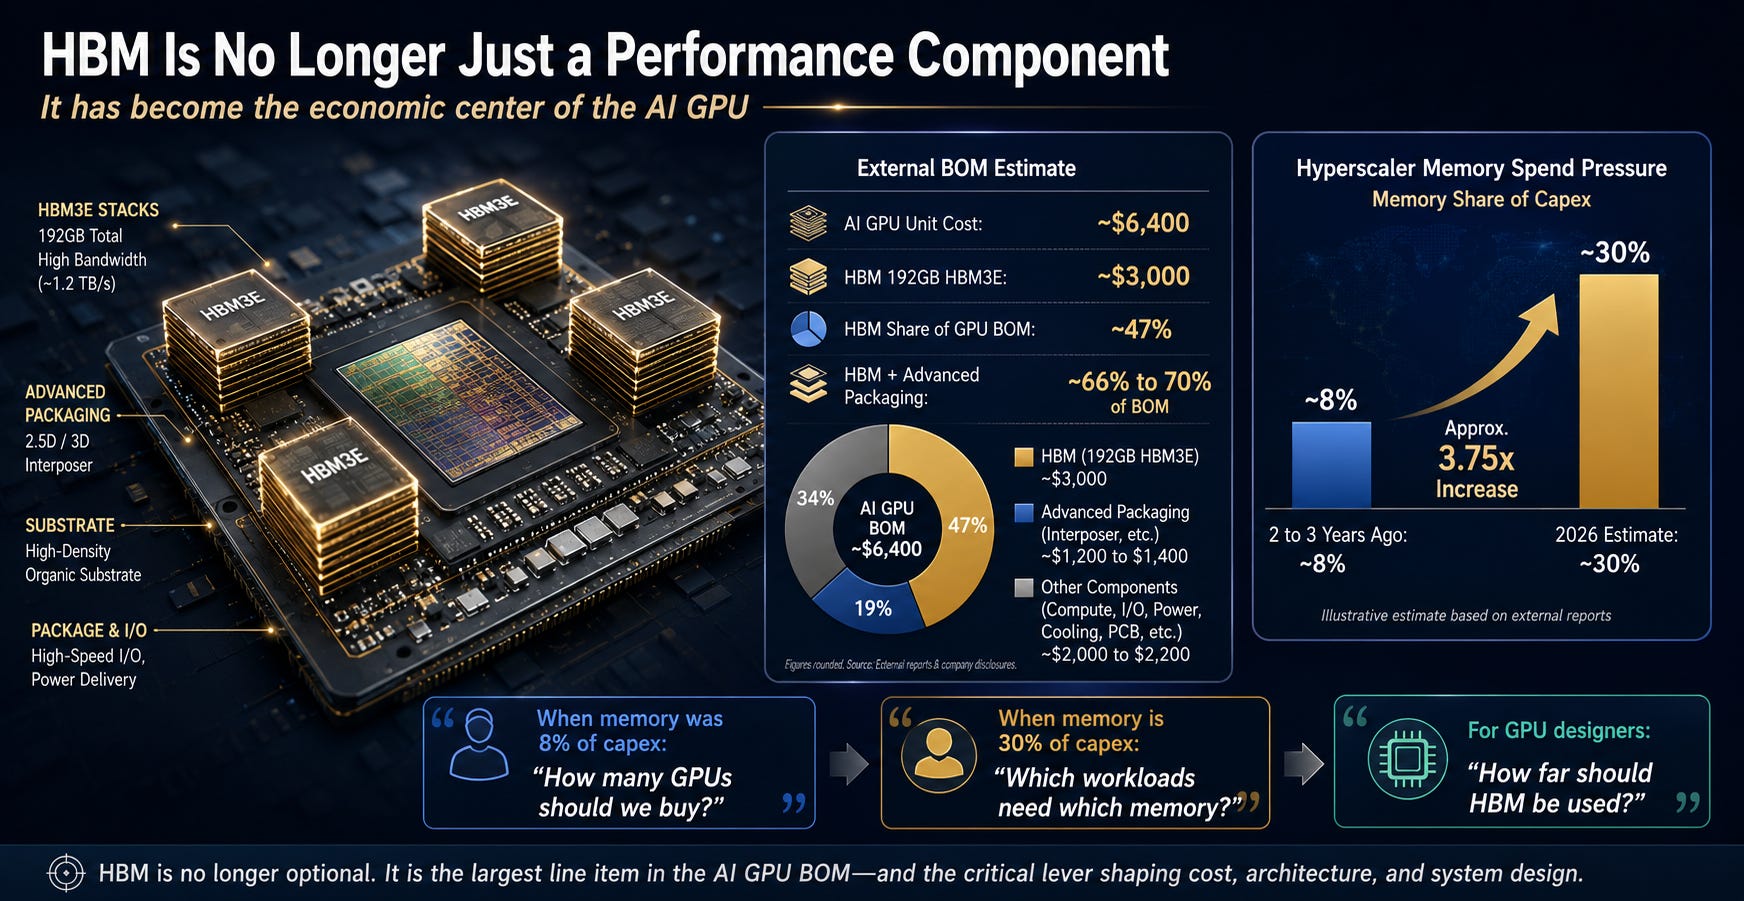
Epoch AI’s external BOM model estimates the unit cost of an NVIDIA B200/B300 at roughly $6,400. BOM (Bill of Materials) is the component cost sheet for building one product. Of that, the estimated cost of 192GB HBM3E is roughly $3,000.
A simple division puts HBM at about 47% of one GPU’s cost. Add advanced packaging, and estimates put HBM plus packaging at roughly 66 to 70% of the GPU BOM.
This is not NVIDIA internal accounting. It is an external model’s estimate. But the directional read is clear: HBM has become not just the GPU’s core performance component but also the central line item on the cost sheet.
When a single component accounts for nearly half the finished product’s cost, the product maker will either find ways to use that component more efficiently or start substituting it with something else wherever possible. The relationship between GPU and HBM is at exactly this point.
Hyperscalers face the same pressure.
Some reports estimate that roughly 30% of hyperscaler 2026 capex will go to memory. Thirty percent of $725B is about $217B. The exact budget is not precise, but the scale is informative. The memory line item that was roughly 8% of capex two to three years ago has, by some estimates, climbed to 30%. That is roughly 3.75x.
When memory is an 8% component of capex, the question hyperscalers ask is: “How many GPUs should we buy?”
When memory climbs to a 30% line item, the question changes: “Which memory goes where?”
NVIDIA is in the same position. When HBM accounts for roughly half of a single GPU’s cost, “how far should we push HBM?” becomes a question about GPU architecture itself.
This cost problem does not stop at the buyer side.
The fact that HBM has moved to the center of GPU BOM and hyperscaler capex is not automatically good news for memory vendors either. Memory vendors cannot make HBM infinitely. The same wafer can go to HBM, or it can go to conventional DRAM or LPDDR.
A wafer is the silicon disc used to manufacture semiconductors. How many chips you can cut from one wafer is the fundamental unit of semiconductor economics. A memory vendor can use that same wafer for HBM or for regular DDR5. Same raw material, different products.
The moment platform owners start asking “how far should we push HBM?” a different question arises on the memory vendor side.
Is putting this wafer into HBM really the best business?
From here, HBM shortage stops being a simple demand story and becomes a question of wafer allocation economics. HBM’s high price is a cost problem for buyers and a wafer allocation problem for sellers.
Expensive HBM Raises Questions for Memory Vendors Too
An HBM Wafer Is Not a DDR5 Wafer
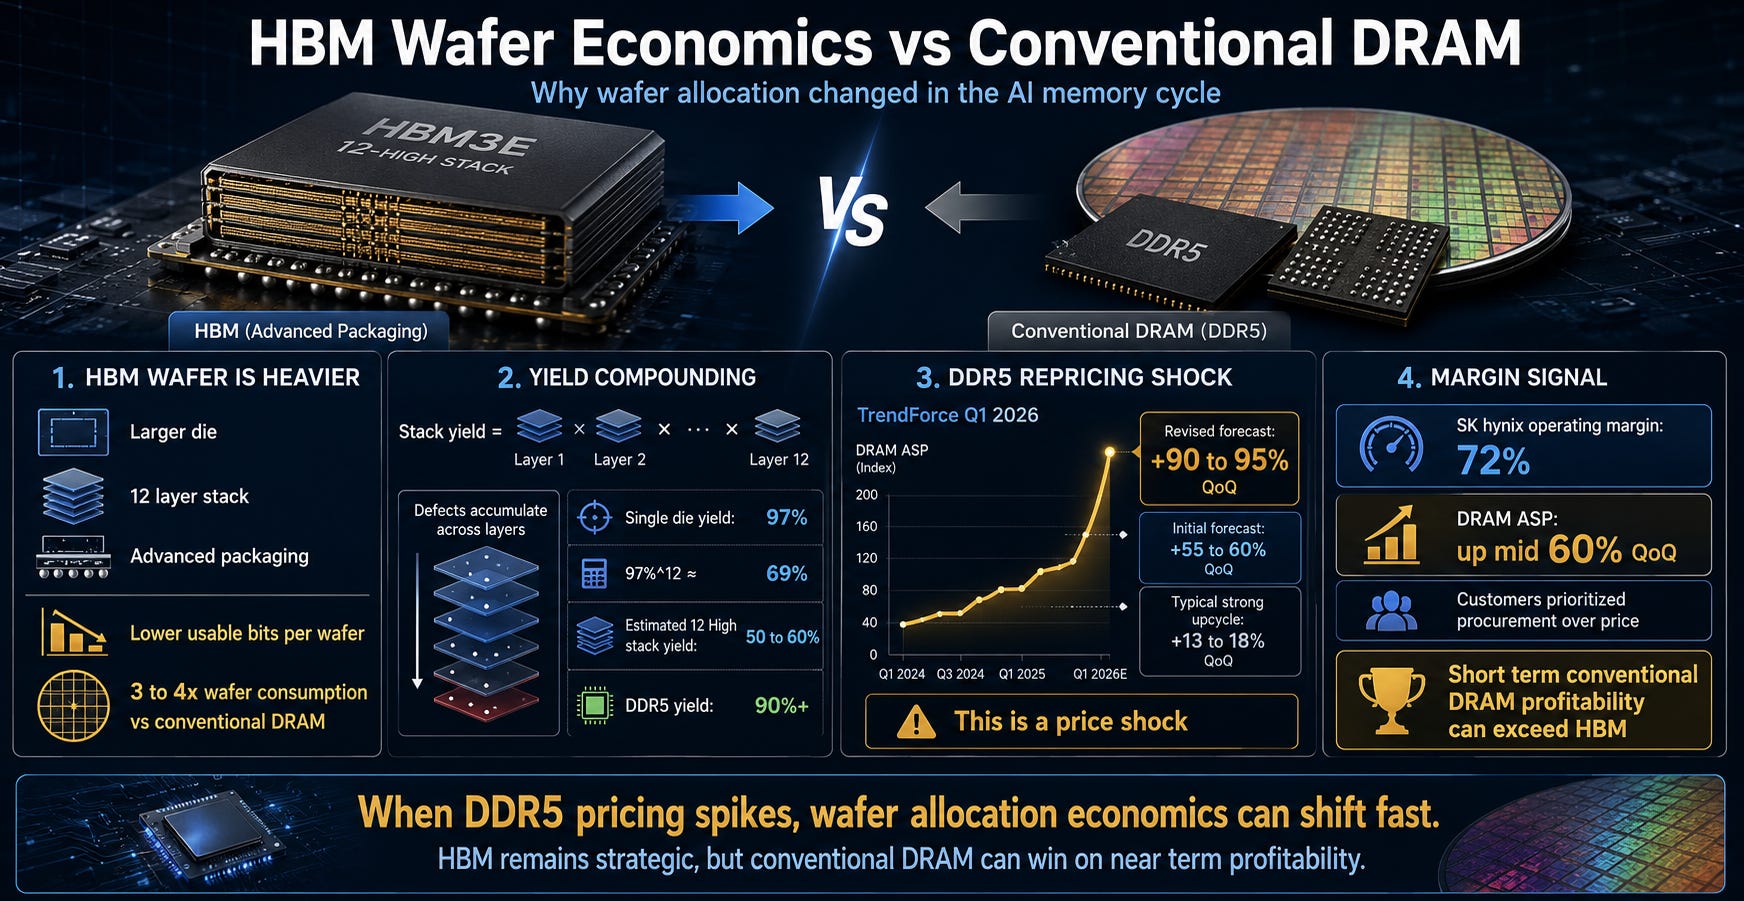
From a memory vendor’s perspective, producing one wafer of HBM is not the same as producing one wafer of conventional DRAM. HBM dies are larger, they must be stacked 12 layers high, yield degrades at each layer, and additional advanced packaging steps are required. The usable bits per wafer are far lower than conventional DRAM.
Yield is the percentage of functional, usable chips from one wafer. If 100 chips are made and 60 work, yield is 60%. Because HBM stacks 12 layers, defects accumulate at each layer. Even if single-layer yield is 97%, stacking 12 layers drops it to 0.97 to the twelfth power, roughly 69%. In practice, the stacking process itself introduces additional defects.
Industry estimates put HBM’s wafer consumption at 3 to 4x that of conventional DRAM. Yield for 12-Hi stacks is estimated at 50 to 60%. DDR5 runs above 90%.
On top of this, conventional DRAM prices moved sharply.
DDR5 Repricing Shakes This Threshold
TrendForce initially projected Q1 conventional DRAM contract prices rising 55 to 60% QoQ in early January 2026, then revised upward to 90 to 95% QoQ in early February. QoQ is quarter-over-quarter change.
Server DRAM was already projected at 60%+ growth in the January forecast.
For context on how extraordinary these numbers are: in a typical strong memory upcycle, 13 to 18% quarterly increases are considered strong. This quarter hit 90%. This is not a normal upturn. It is a price shock that disrupts wafer allocation economics.
During the same period, SK hynix recorded 72% operating margin, an all-time company high. The company identified the ASP (average selling price) driver as conventional DRAM, not HBM. On its 1Q26 earnings call, SK hynix explained that DRAM ASP rose mid-60% quarter over quarter, with supply-demand imbalance continuing and customers prioritizing procurement over price.
Samsung’s Q1 2026 earnings call matters too. Reports indicate Samsung acknowledged that conventional DRAM profitability exceeded HBM in the short term. This sounds counterintuitive at first. HBM is classified as strategic, conventional DRAM as commodity, yet the commodity beat the strategic product’s margin in a given quarter.
The Real Question Is Not ASP but Profit per Wafer
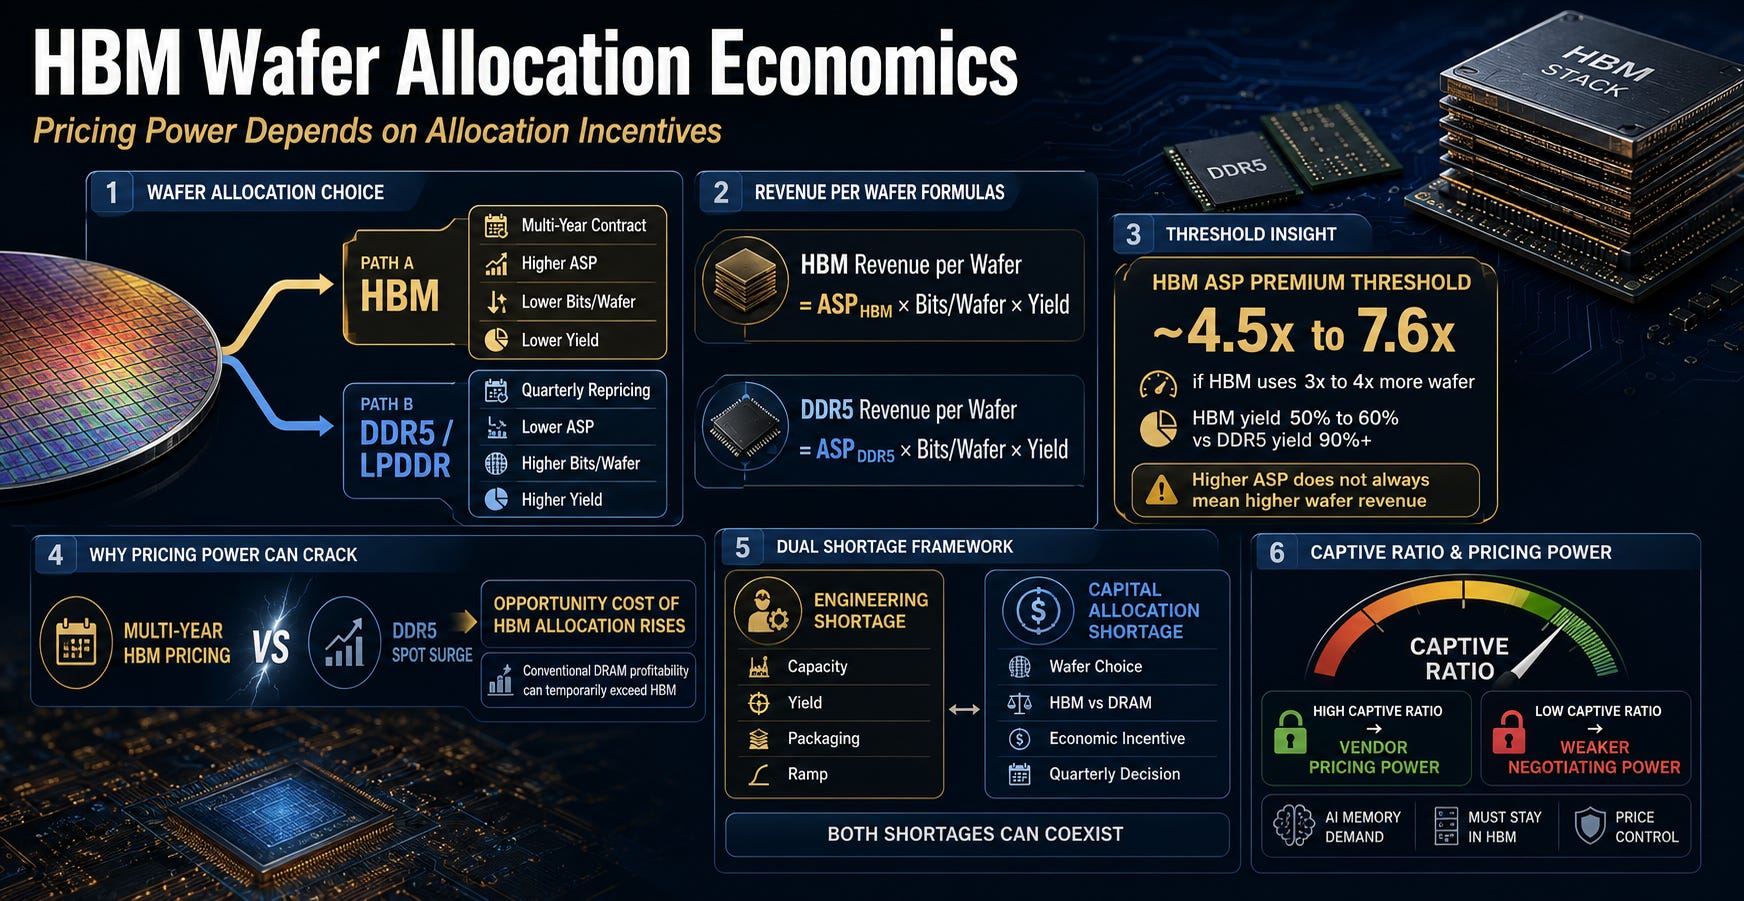
From a memory vendor’s perspective, picking up one wafer presents two alternatives. It can go to HBM, or it can go to DDR5 or LPDDR. Putting it into HBM means receiving multi-year contract pricing. Putting it into DDR5 means receiving rapidly repricing spot-like pricing that adjusts every quarter.
Normally, HBM is the far better business. ASP is much higher. But when bits per wafer are lower and yield is worse, HBM does not automatically win on a per-wafer revenue basis even with higher ASP.
To understand wafer allocation, run through the formula once. This is not official segment margin. It is a sensitivity exercise.
HBM wafer revenue = ASP_HBM × HBM bits per wafer × HBM yield
DDR5 wafer revenue = ASP_DDR5 × DDR5 bits per wafer × DDR5 yield
If HBM consumes 3 to 4x more wafer and HBM yield is 50 to 60% while DDR5 yield exceeds 90%, then HBM needs to carry an ASP roughly 4.5 to 7.6x higher than conventional DRAM to remain commercially attractive on a per-wafer basis.
Market data suggests the ASP gap between HBM3E and server DDR5 has narrowed to 4 to 5x or less in certain quarters. This comparison is not a conclusion. It is a threshold.
Why this threshold matters.
HBM is already locked inside multi-year contracts, making it difficult to raise prices that same quarter. When you are delivering at a price set three years ago while DDR5 spot prices are jumping 90% in a single quarter, the opportunity cost of putting a wafer into HBM rises sharply.
Samsung acknowledging in 1Q26 that conventional DRAM profitability exceeded HBM in the short term is not a signal of HBM weakness. It is a signal that even when the capability to produce HBM exists, the economic incentive to allocate wafers there can waver.
HBM shortage operates on two axes. One is the engineering shortage. HBM is physically hard to produce in sufficient volume, and this can ease over time through capacity expansion and yield improvement.
The other is the capital allocation shortage. Memory vendors asking every quarter whether this wafer should go to HBM or conventional DRAM. This one does not get solved by building more fabs. The economic incentive to put wafers into HBM must be maintained.
Both shortages are running simultaneously right now.
If you ask whether this rally can continue, the thing to watch is not total HBM demand. It is where HBM pricing power holds and where it cracks.
This article calls the variable that determines that pricing power the captive ratio:
‘the share of total AI memory demand that must remain inside HBM.’
If this ratio stays high, memory vendors can hold prices. If it falls, HBM can sell in volume and still lose ground in price negotiations.
Below, this article deep dives into the specific strategies on each side of this captive ratio.
How NVIDIA is disaggregating inference to reduce HBM dependency, how hyperscalers are redefining the memory mix with custom silicon, and how memory vendors are fighting back.
Finally, it maps how this balance of power shifts over time, and what that means for the trajectory of the memory stock rally.